
The 2021 hurricane season
As usual, the team of Professor Philip Klotzbach from theUniversity of Colorado presented his forecast for the hurricane season 2021 at the beginning of April, i.e. 2 months before the official start of the season. This forecast will be updated in early June, either at the start of the hurricane season and early August, or just at the start of the most active part of the season.
| Forecast April 2024 | Forecast June 2024 | Prev July 2024 | Prev August 2024 | evol. | Moy | 2023 | 2022 | 2021 | |
|---|---|---|---|---|---|---|---|---|---|
| Nb of named storms | 23 | - | - | - | - | 14.4 | 20 | 14 | 21 |
| Of stormy days | 115 | - | - | - | - | 69.4 | 99 | 56.25 | 78 |
| No. of hurricanes | 11 | - | - | - | - | 7.2 | 7 | 8 | 7 |
| No. of hurricane days | 45 | - | - | - | - | 27 | 31 | 21.25 | 27.5 |
| No. of major hurricanes | 5 | - | - | - | - | 3.2 | 3 | 2 | 4 |
| No. of major hurricane days | 15 | - | - | - | - | 7.4 | 7.75 | 5.75 | 13.5 |
| Cumulative energy (ACE) | 210 | - | - | - | - | 123 | 146 | 95 | 145 |
As can be seen from the table above, the 2021 hurricane season in the Atlantic is forecast to be more active than the 1991-2020 average by 10% to 20% except for the number of days with storms or hurricanes where this activity is forecast to be more than 30% above average. In this reading of the forecast, it is necessary to take into account evolution of the reference period which rose this year from 1981-2010 to 1991-2020 with an increase of 15% to 20% in average activity over the period. This has the effect of reducing the difference in expected activity from the reference period.
The 2021 hurricane forecast in detail
Overall we have seen that the activity for the coming season is 10% to 20% higher than the average of the last 30 years, now we will detail each criterion of this forecast.
- The number of named storms : these are all the systems that will be named by the nhc during their reinforcement. Tropical depressions and waves are not one of them. The average of these last 30 years is 14.4 for 17 this season which gives a higher activity of the order of 18%. But beware because the last 30 years have seen the two most active seasons in history (2 and 2005) with 2020 and 28 storms respectively, which has greatly inflated the average. We can therefore estimate that the forecast is much more active than an average year (excluding the 30 exceptional years) and rather close to 2%
- The Number of days of named storms : This is the number of days a storm will be active with storm status or higher. The activity forecast is very high compared to the average with 80 days. This means that there should be at least one named hurricane system for almost 3 months, or half of the season.
- The number of hurricanes : Hurricanes are storms with wind speeds exceeding 63 kts (119 km / h). The number of hurricanes forecast is 8 for an average of 7.2. Even if the percentage of change is high (11%) the low number makes the difference little marked.
- The number of hurricane days : As for storms, the number of hurricane days is expected to be very high compared to the average with 35 for 27. More than a month with at least 1 hurricane in progress on the basin, it is a significant pressure on population.
- The number of major hurricanes : Major hurricanes are category 3 to 5, i.e. more than 96 kts wind (178 km / h). The forecast is 4 to 3.2 on average, which does not fundamentally change the risk of destruction generated by these systems.
- The number of days of major hurricanes : With 9 days for 7.4 on average, this data is up weaker than the other day forecasts (storms or hurricanes). But that's more than an extra day for a destructive system and it can have disastrous consequences.
- The cumulative ACE index : it is a calculation which makes it possible to globally determine the destructive intensity of a hurricane system or a hurricane season. It is determined according to the wind speed every 6 hours. It is the sum of the speeds (in kts) of wind squared estimated every 6 hours. For the sake of understanding this figure is divided by 10.000 to make it understandable. The ACE index is expected to be much higher than average.
The activity for this 2021 season is therefore forecast to increase significantly compared to the last 30 years. It should be noted, however, that this increase concerns more the number of days of cyclonic activity than the number of systems itself. In summary, it is a little more cyclonic systems but which will have a much longer lifespan (20 to 30% on average). We can also imagine that the significant forecast underestimation of last season has pushed a little to take the high margin of this season's forecast.
But despite the fact that the 2021 season is expected to be more active than the average for the past 30 years, it is expected to be largely less active than the 2020 season.
What is the cyclone forecast based on?
Making a forecast for the entire season 2 months before it starts is a perilous exercise. We are over a period that is too short for the climate models to be relevant and too long for the weather models to run.
The forecast is therefore based on a model developed specifically for this exercise but also on statistical data. Overall, between 2010 and 2019 this forecast was quite relevant even if it missed the ACE index cumulated in 2017 with the 2 monsters Irma and Maria which totally distorted the statistics. On the other hand, in 2020, this forecast from the University of Colorado for the month of April completely missed the mark by underestimating the forecast by more than 50%. This is a first since researchers (notably Dr Gray) started this kind of work. The question now is whether the exceptional 2020 season will be a statistical artefact like that of 2005 or whether it paves the way for more and more active seasons for the next few years / decades.
What conclusion can be drawn for the 2021 hurricane season in the West Indies?
I often repeat that a seasonal forecast is a given like any other and thatit is not relevant at the scale of small territories like ours in the Lesser Antilles. Last season demonstrated it once again by completely sparing the West Indies for a season which has nevertheless broken many activity records. It was the same in 2005 and 1967, the other very active seasons since 1950.
The seasonal forecast or the statistics of a season are only global scientific data quite uncorrelated from what we experience on a daily basis on our islands. These are only global trends. If you take the only Category 3 hurricane of the season on your home, you will find that the season has been very active and violent although overall it has not been. Likewise, even if the season has broken almost all activity records as in 2020 and you have not been affected by any system or even in a trajectory, your feelings will be very far from the global static and forecast reality. .
We must therefore prepare, each season and whatever the forecast, as if we were going to be affected by a violent cyclonic system. Prevention and preparation are the only solutions that allow a more peaceful hurricane season in the West Indies and limit the impact of a possible disaster as much as possible.
To read on the same subject
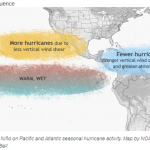
The impact of El Nino on cyclones in the Atlantic
4.89 / 5 (66) The oscillation ENSO is a cyclical climatic event which has 3 phases: El Nino, La Nina and a neutral phase. Despite a location